Atlas story
Chinese and Vietnamese Southern California
The San Gabriel Valley and Little Saigon, mapped against each other ZIP code by ZIP code across Los Angeles and Orange counties.
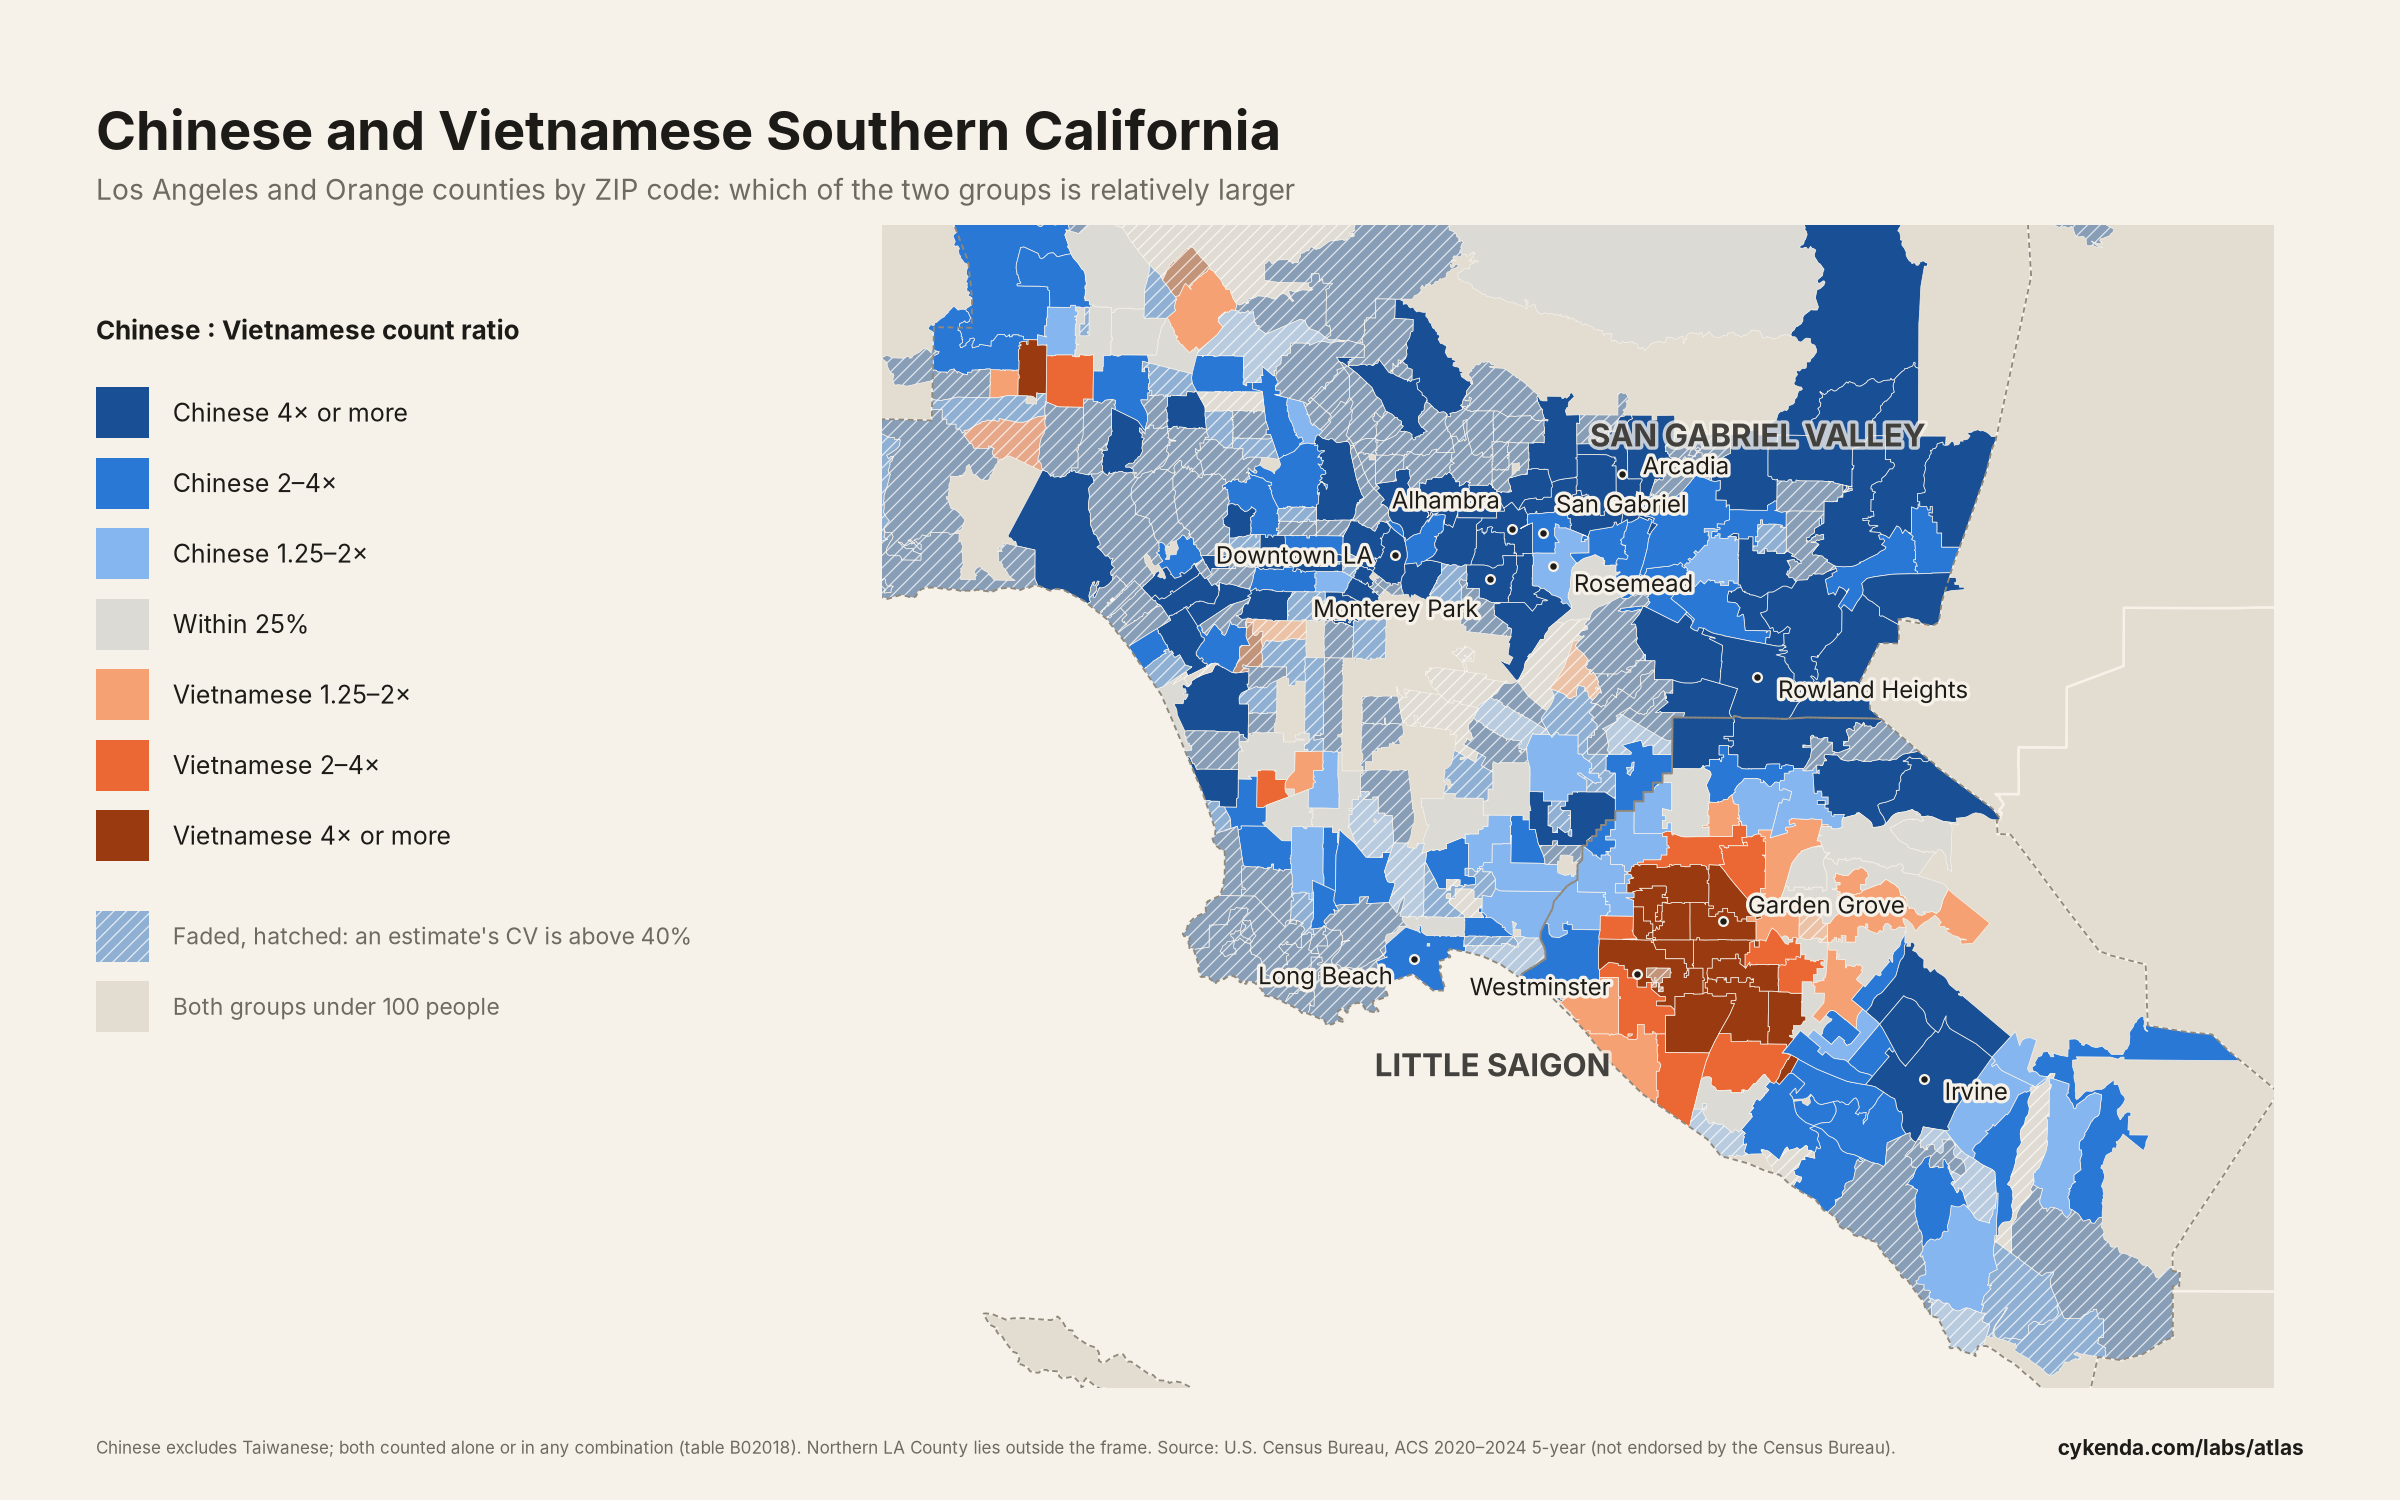
East of downtown Los Angeles, in the San Gabriel Valley, Chinese Americans make up a large share of many suburbs. To the south, in Orange County, Westminster and Garden Grove form Little Saigon.
This map sets the two groups against each other, ZIP code by ZIP code: blue where Chinese Americans are relatively more numerous, orange where Vietnamese Americans are, and grey where the two are within 25% of each other.
What stands out
- Los Angeles and Orange counties are home to 675,585 Chinese Americans (5.2% of residents) and 380,962 Vietnamese Americans (2.9%). That is 12% of all Chinese Americans in the US and 16% of all Vietnamese Americans.
- The ZIP code with the highest Chinese share is 91755 in Monterey Park, where 58% of residents are Chinese American. For Vietnamese Americans it is 92683 in Westminster, at 48%.
- 92683 in Westminster has more Vietnamese American residents than any other ZIP code in the country: 42,691, 2.3 times the next largest (92843, Garden Grove).
- Of the 334 ZIP codes where at least one of the two groups numbers 100 or more, 263 have relatively more Chinese Americans, 41 relatively more Vietnamese Americans, and 30 are within 25% of even.
- The two cores are about 32 km apart: that is the distance between the population-weighted centres of the ten ZIP codes with the highest Chinese share and the ten with the highest Vietnamese share.
- The two groups are not separate: 38% of the region's Vietnamese Americans live in ZIP codes that lean Chinese. In 91770 (Rosemead), 43% of residents are Chinese American and 22% Vietnamese American, the highest share for both at once among ZIP codes where each group numbers at least 1,000.
The ten ZIP codes with the highest share
Chinese Americans
| ZIP code | Area | Chinese share | Chinese residents (± MOE) | Vietnamese share | |
|---|---|---|---|---|---|
| 91755 | Monterey Park | 57.6% | 15,432 ± 1,445 | 6.0% | Compare on map |
| 91108 | San Marino | 51.4% | 6,368 ± 1,065 | 2.7% | Compare on map |
| 91780 | Temple City | 45.6% | 16,222 ± 1,285 | 10.6% | Compare on map |
| 91776 | San Gabriel | 45.2% | 16,719 ± 1,455 | 12.9% | Compare on map |
| 91754 | Monterey Park | 43.7% | 14,087 ± 1,216 | 4.7% | Compare on map |
| 91770 | Rosemead | 43.0% | 25,100 ± 1,579 | 21.9% | Compare on map |
| 91748 | Rowland Heights | 40.4% | 17,173 ± 1,453 | 2.8% | Compare on map |
| 91789 | Walnut | 39.6% | 15,962 ± 1,364 | 2.4% | Compare on map |
| 91006 | Arcadia | 39.3% | 12,423 ± 1,108 | 2.9% | Compare on map |
| 91801 | Alhambra | 38.9% | 20,767 ± 1,311 | 7.0% | Compare on map |
Vietnamese Americans
| ZIP code | Area | Vietnamese share | Vietnamese residents (± MOE) | Chinese share | |
|---|---|---|---|---|---|
| 92683 | Westminster | 47.5% | 42,691 ± 2,440 | 3.2% | Compare on map |
| 92844 | Garden Grove | 45.2% | 10,488 ± 1,066 | 2.6% | Compare on map |
| 92841 | Garden Grove | 40.9% | 13,586 ± 1,467 | 4.2% | Compare on map |
| 92843 | Garden Grove | 39.9% | 18,516 ± 2,097 | 1.5% | Compare on map |
| 92655 | Midway City | 38.2% | 3,062 ± 728 | 1.6% | Compare on map |
| 92840 | Garden Grove | 32.2% | 17,537 ± 1,376 | 1.9% | Compare on map |
| 92708 | Fountain Valley | 26.0% | 14,650 ± 1,457 | 4.7% | Compare on map |
| 91770 | Rosemead | 21.9% | 12,764 ± 1,523 | 43.0% | Compare on map |
| 90680 | Stanton | 17.7% | 5,650 ± 906 | 2.4% | Compare on map |
| 92704 | Santa Ana | 14.8% | 12,181 ± 1,592 | 1.7% | Compare on map |
Download every ZIP code (CSV) Open this comparison on the map
How we made this
- Region: the 375 inhabited ZIP Code Tabulation Areas (the Census Bureau's approximation of ZIP codes) whose largest land area lies in Los Angeles County or Orange County, from the 2020 ZCTA-to-county relationship file.
- Both groups come from table B02018 and are counted "alone or in any combination": a person who reports both Chinese and Vietnamese origin counts in both. "Chinese" excludes Taiwanese, which the table counts separately.
- Colour is the ratio of the two counts in the same ZIP code, (Chinese + 0.5) / (Vietnamese + 0.5), in the same seven classes as the map's compare mode (breaks at 1.25, 2 and 4 times). Because both counts share one denominator, it is also the ratio of the two shares.
- ZIP codes where both groups are under 100 people are left uncoloured. Where either estimate's coefficient of variation (margin of error ÷ 1.645 ÷ estimate) is above 40%, the ZIP code is faded and hatched; 151 of the 334 coloured ZIP codes are. They are still counted in the figures above.
- Tables: ZIP codes with at least 1,000 residents where the group numbers at least 100 with a coefficient of variation of 40% or less.
- Regional totals carry approximate margins of error (square root of the sum of squared ZIP code margins): ± 9,519 Chinese, ± 8,289 Vietnamese. National shares divide by the sum over all ZIP code areas in the 50 states and DC.
- The map frames the Los Angeles basin. Northern Los Angeles County and most of Catalina Island are outside it, but they are included in every figure and in the CSV.
ZIP code place names (the “Area” column, the place names in the text and the “place” column of the CSV): GeoNames, licensed under CC BY 4.0. Adapted by Cykenda Labs Atlas: one place name per ZIP Code, attached to the ZIP Code Tabulation Area (ZCTA) of the same number. GeoNames provides the data “as is” without warranty or any representation of accuracy, timeliness or completeness.