Atlas story
The largest Asian and Latino group in every state
Which Asian group and which Latino origin is the biggest in each state, and which come second where Mexican Americans lead. Where the gap is within the margin of error, we say so.
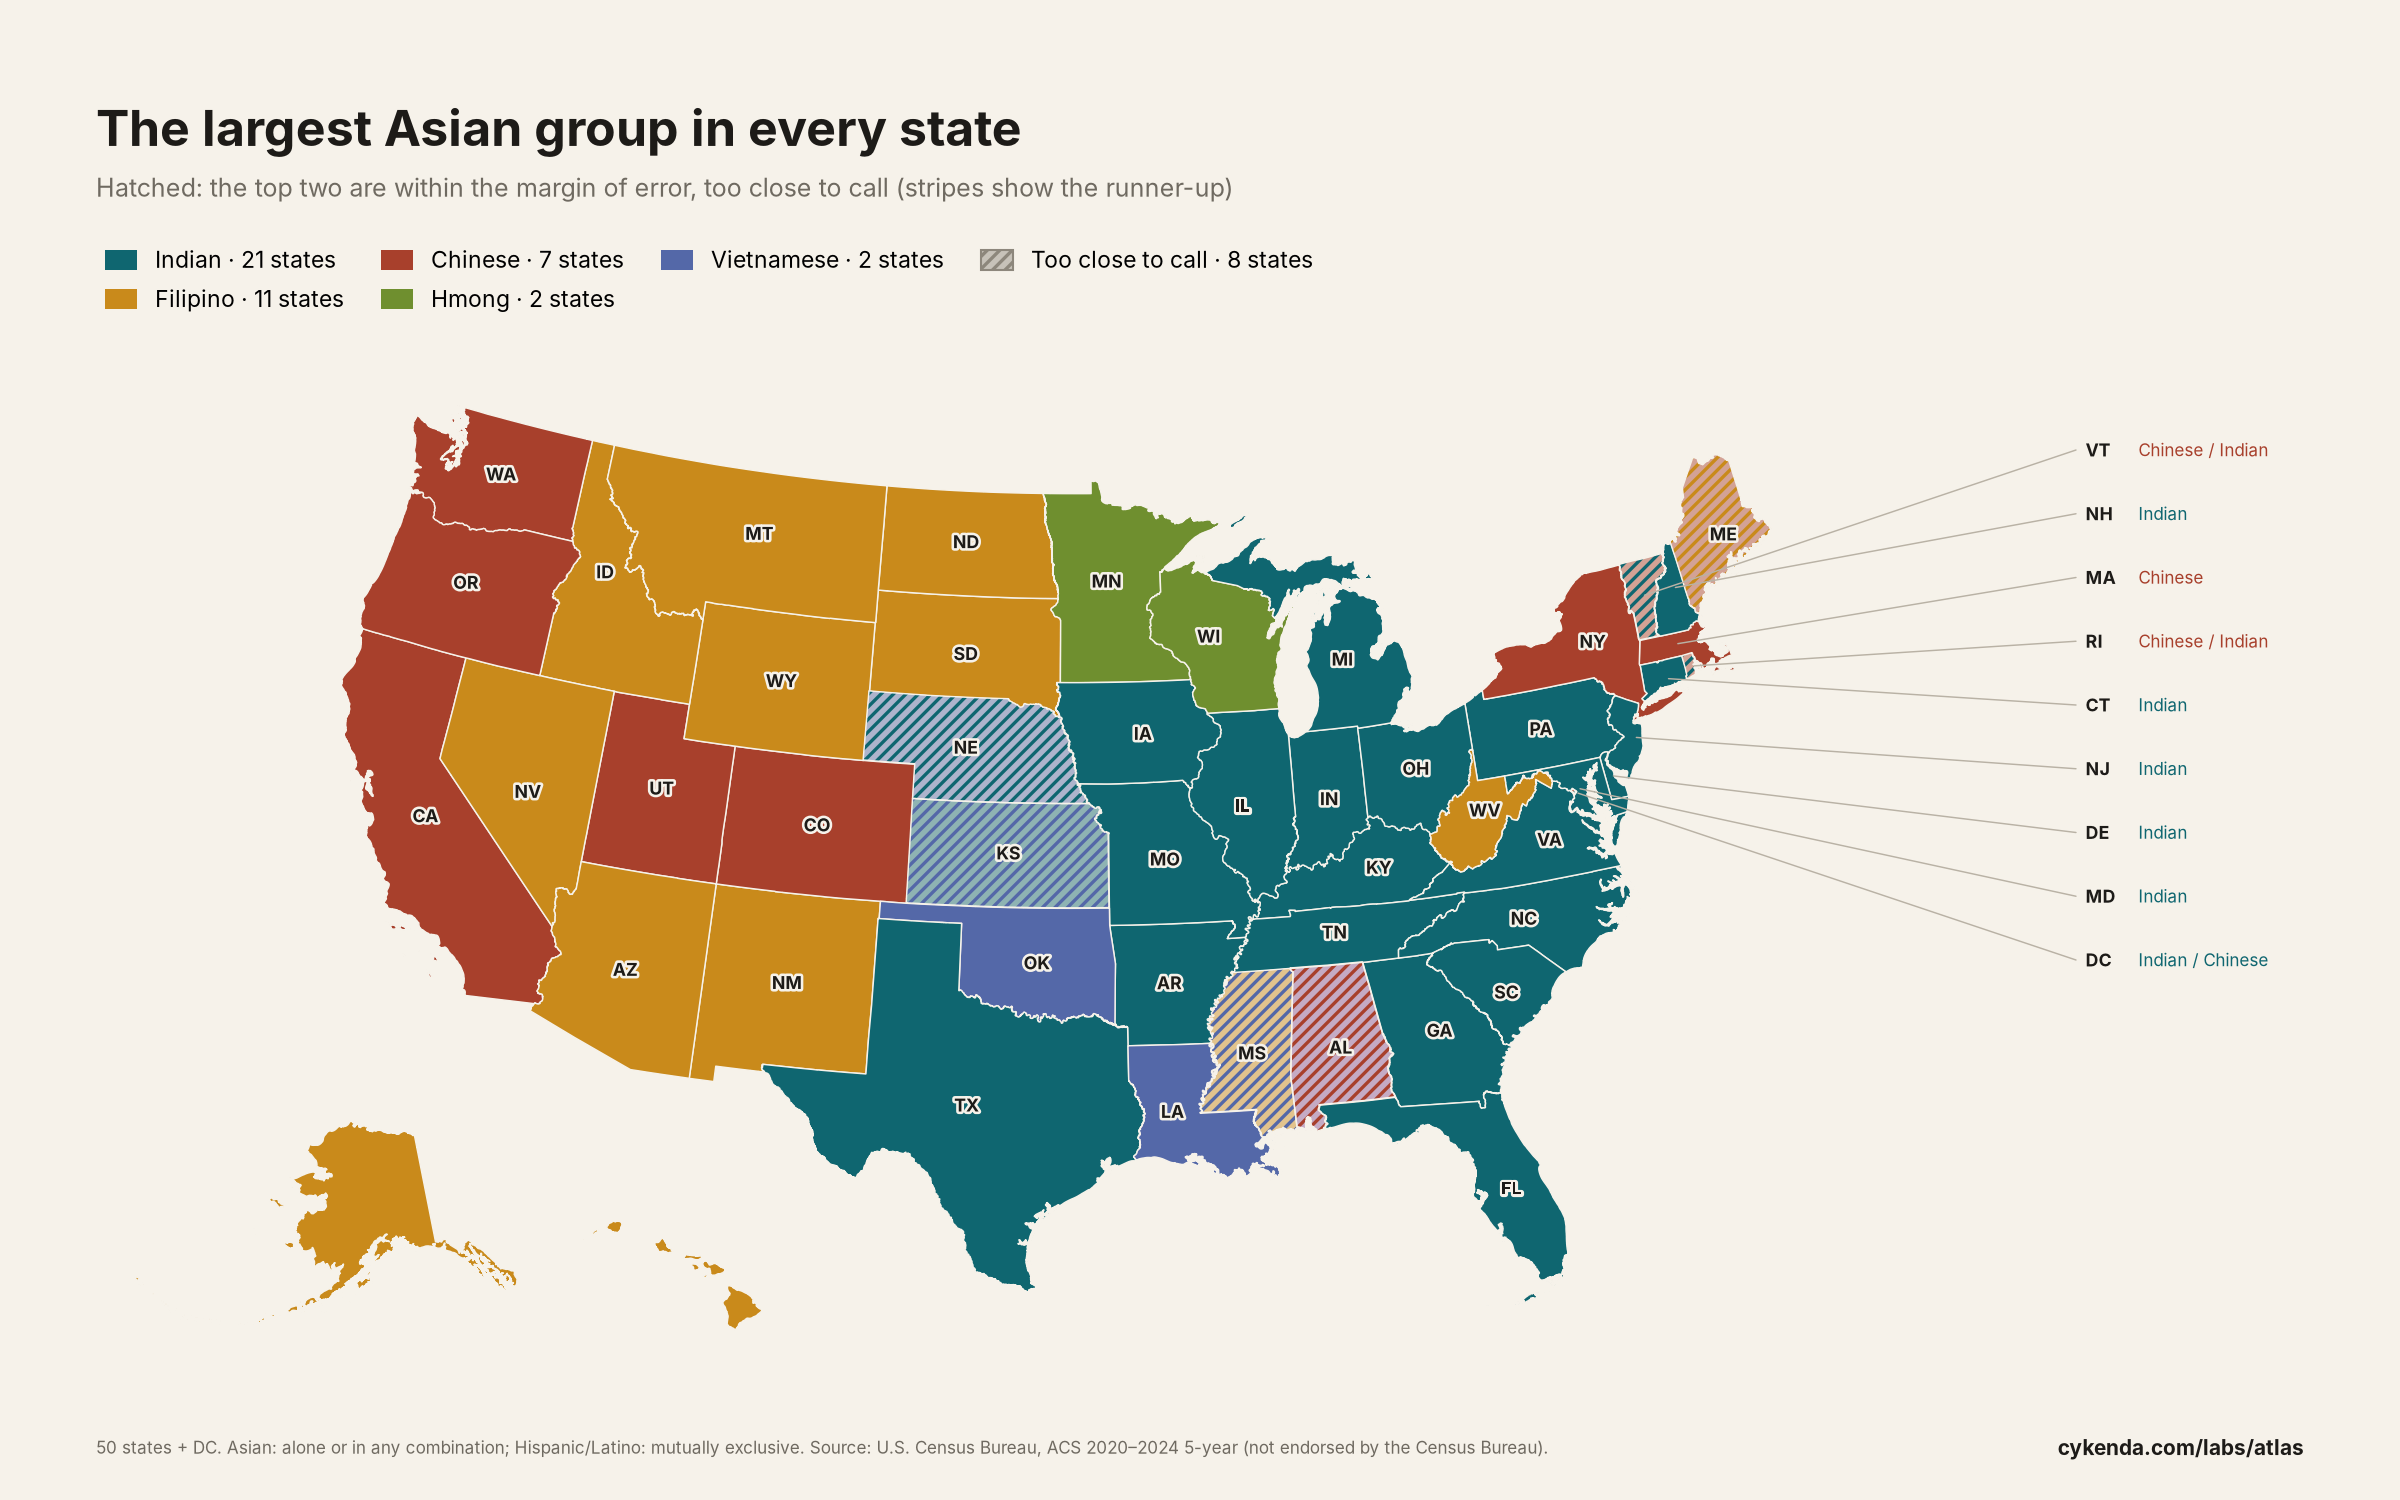
Our other story looks at where groups are most concentrated. This one asks a plainer question: in each state, which group is the largest? The answers differ more than you might expect.
Every lead on these maps has passed the Census Bureau's test for comparing two survey estimates. Where the top two groups are within each other's margin of error, the state is hatched as too close to call instead of being handed to one of them.
What stands out
- Indian Americans are the largest Asian group in 21 states, followed by Filipino (11) and Chinese (7).
- Hmong Americans lead in Minnesota, Wisconsin.
- Vietnamese Americans lead in Louisiana, Oklahoma.
- In 8 states the top two Asian groups are within the margin of error: Alabama (Korean vs. Chinese), District of Columbia (Indian vs. Chinese), Kansas (Indian vs. Vietnamese), Maine (Chinese vs. Filipino), Mississippi (Filipino vs. Vietnamese), Nebraska (Vietnamese vs. Indian), Rhode Island (Chinese vs. Indian), Vermont (Chinese vs. Indian).
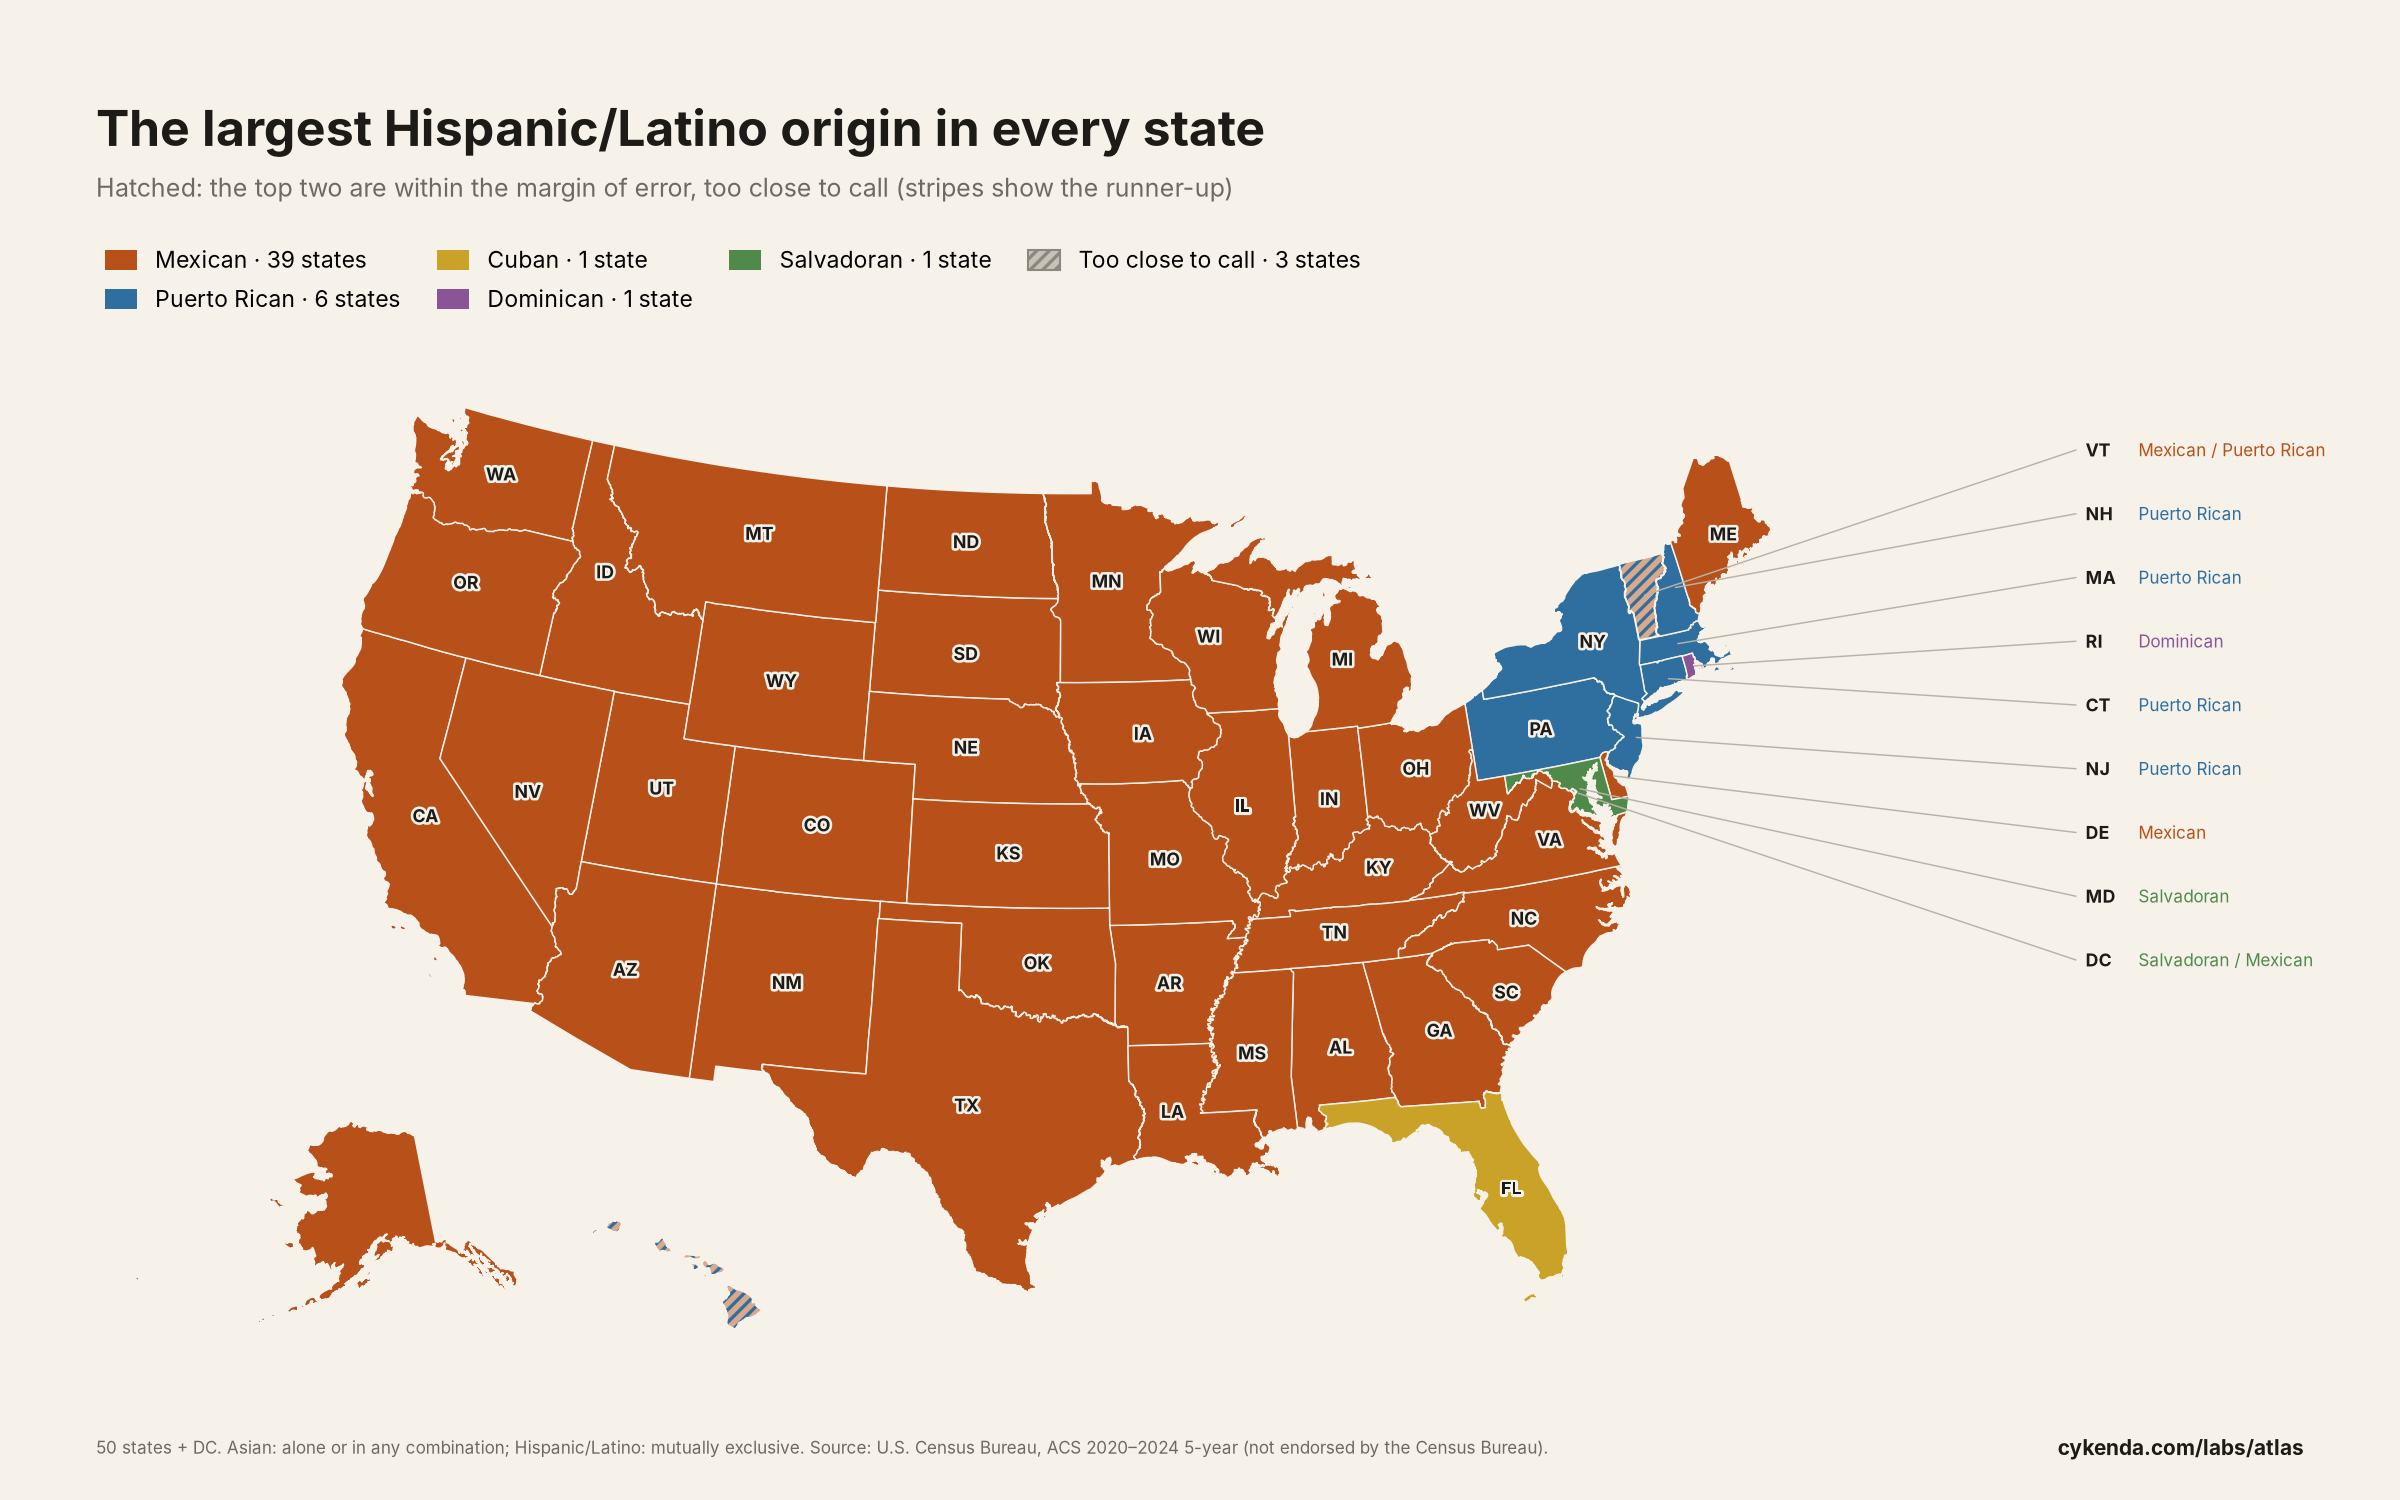
- Mexican Americans are the largest Latino origin in 39 states. The exceptions: Connecticut (Puerto Rican), Florida (Cuban), Maryland (Salvadoran), Massachusetts (Puerto Rican), New Hampshire (Puerto Rican), New Jersey (Puerto Rican), New York (Puerto Rican), Pennsylvania (Puerto Rican), Rhode Island (Dominican).
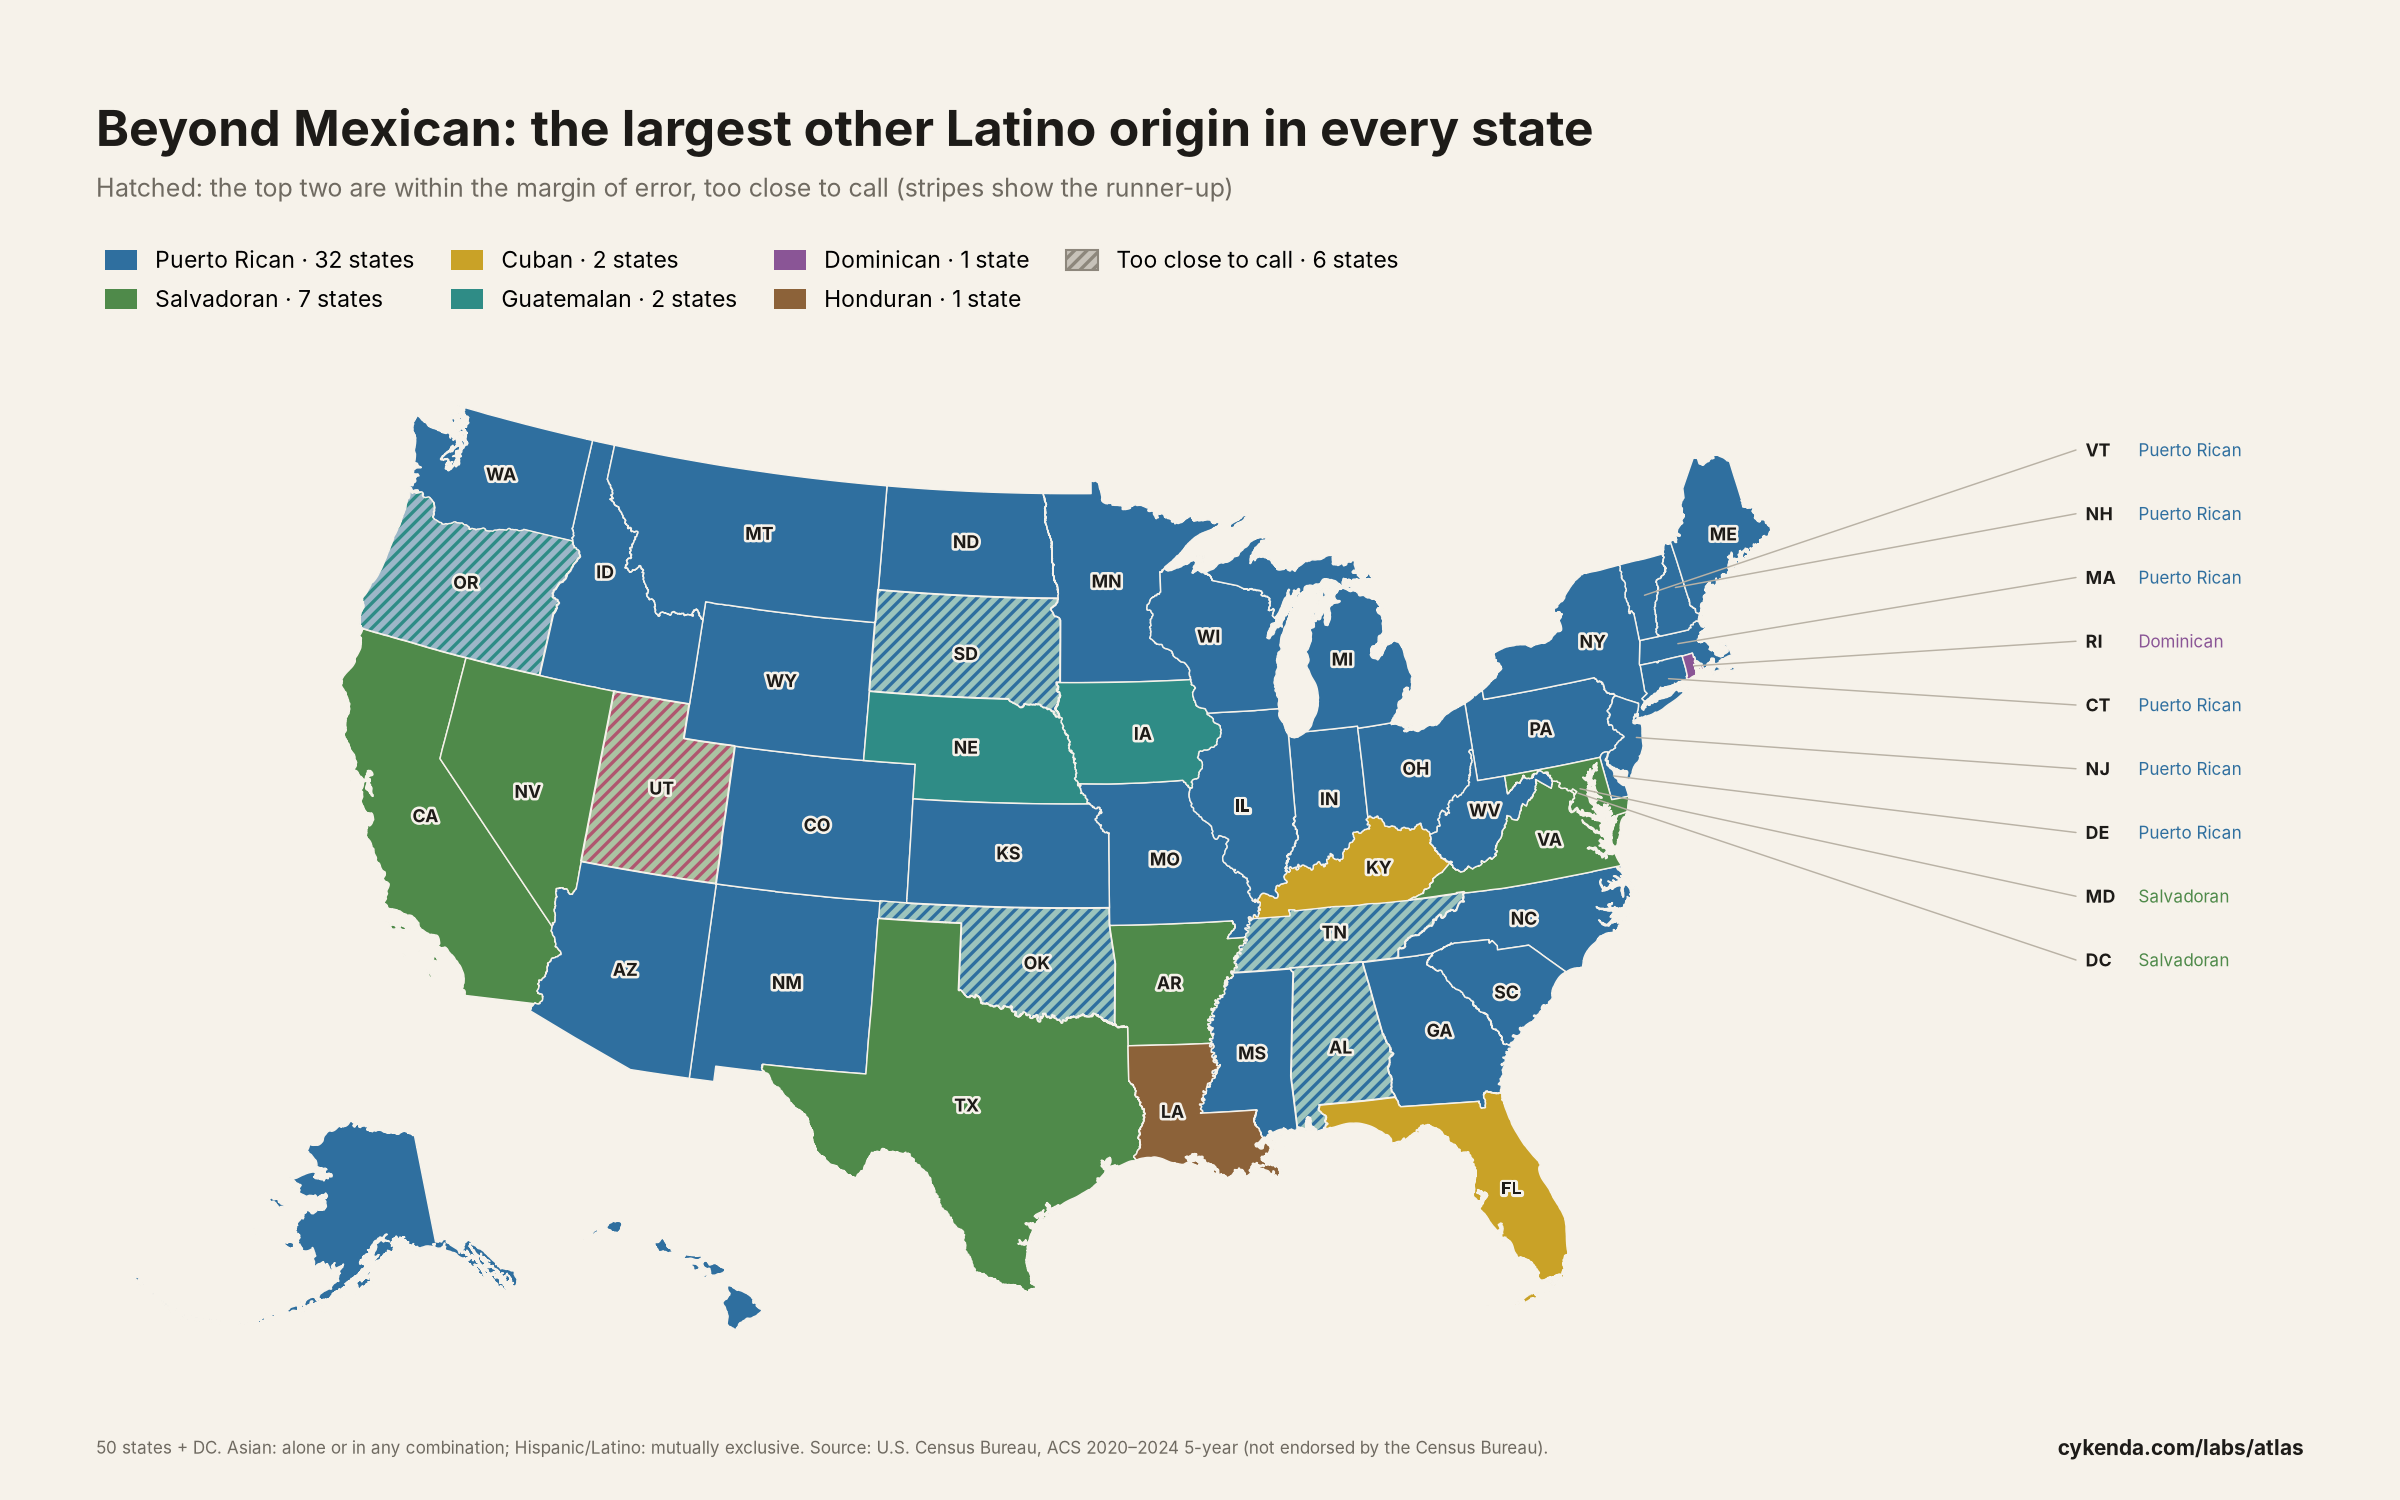
- Set Mexican Americans aside and Puerto Rican Americans lead in 32 states; Salvadoran in 7, Cuban in 2, Guatemalan in 2, Dominican in 1, Honduran in 1.
The largest Hispanic/Latino origin
Beyond Mexican: the next-largest Latino origin
Every state
| State | Largest Asian group | Largest Latino origin | Largest other than Mexican |
|---|---|---|---|
| Alabama | Korean 19,244 ± 1,479 too close to call: vs. Chinese 18,513 ± 1,539 | Mexican 164,039 ± 3,915 | Guatemalan 27,048 ± 2,734 too close to call: vs. Puerto Rican 25,521 ± 2,074 |
| Alaska | Filipino 36,271 ± 1,862 | Mexican 28,530 ± 1,451 | Puerto Rican 6,957 ± 842 |
| Arizona | Filipino 89,681 ± 3,692 | Mexican 1,987,288 ± 8,181 | Puerto Rican 53,298 ± 3,115 |
| Arkansas | Indian 15,000 ± 1,429 | Mexican 191,090 ± 3,438 | Salvadoran 26,546 ± 2,392 |
| California | Chinese 1,903,736 ± 16,935 | Mexican 12,695,747 ± 20,558 | Salvadoran 785,206 ± 12,798 |
| Colorado | Chinese 52,333 ± 2,293 | Mexican 927,743 ± 9,028 | Puerto Rican 41,982 ± 2,960 |
| Connecticut | Indian 67,991 ± 2,382 | Puerto Rican 292,677 ± 5,162 | Puerto Rican 292,677 ± 5,162 |
| Delaware | Indian 18,531 ± 1,293 | Mexican 36,799 ± 2,527 | Puerto Rican 32,044 ± 1,916 |
| District of Columbia | Indian 10,473 ± 994 too close to call: vs. Chinese 10,373 ± 906 | Salvadoran 18,098 ± 2,163 too close to call: vs. Mexican 16,516 ± 1,611 | Salvadoran 18,098 ± 2,163 |
| Florida | Indian 231,340 ± 5,903 | Cuban 1,630,295 ± 15,820 | Cuban 1,630,295 ± 15,820 |
| Georgia | Indian 191,013 ± 5,452 | Mexican 604,477 ± 9,372 | Puerto Rican 126,566 ± 4,843 |
| Hawaii | Filipino 372,011 ± 5,548 | Mexican 49,081 ± 2,339 too close to call: vs. Puerto Rican 47,134 ± 2,141 | Puerto Rican 47,134 ± 2,141 |
| Idaho | Filipino 13,793 ± 1,132 | Mexican 211,895 ± 2,442 | Puerto Rican 6,383 ± 899 |
| Illinois | Indian 280,737 ± 6,286 | Mexican 1,825,458 ± 9,864 | Puerto Rican 207,101 ± 6,396 |
| Indiana | Indian 60,358 ± 3,070 | Mexican 393,454 ± 4,964 | Puerto Rican 53,919 ± 3,078 |
| Iowa | Indian 18,282 ± 1,797 | Mexican 161,275 ± 2,701 | Guatemalan 14,308 ± 1,512 |
| Kansas | Indian 21,969 ± 1,667 too close to call: vs. Vietnamese 20,167 ± 1,341 | Mexican 307,934 ± 3,052 | Puerto Rican 17,748 ± 1,523 |
| Kentucky | Indian 19,937 ± 1,858 | Mexican 111,299 ± 3,698 | Cuban 34,404 ± 2,595 |
| Louisiana | Vietnamese 31,753 ± 1,773 | Mexican 99,275 ± 4,113 | Honduran 74,329 ± 4,633 |
| Maine | Chinese 6,053 ± 780 too close to call: vs. Filipino 5,236 ± 678 | Mexican 9,096 ± 717 | Puerto Rican 6,662 ± 676 |
| Maryland | Indian 116,946 ± 4,584 | Salvadoran 219,307 ± 7,746 | Salvadoran 219,307 ± 7,746 |
| Massachusetts | Chinese 207,658 ± 3,796 | Puerto Rican 326,360 ± 7,265 | Puerto Rican 326,360 ± 7,265 |
| Michigan | Indian 138,644 ± 4,279 | Mexican 402,413 ± 3,876 | Puerto Rican 52,736 ± 1,993 |
| Minnesota | Hmong 105,074 ± 3,624 | Mexican 223,736 ± 3,903 | Puerto Rican 18,956 ± 1,629 |
| Mississippi | Filipino 9,776 ± 1,054 too close to call: vs. Vietnamese 8,630 ± 1,000 | Mexican 57,760 ± 2,219 | Puerto Rican 10,017 ± 1,155 |
| Missouri | Indian 41,272 ± 2,354 | Mexican 201,143 ± 3,174 | Puerto Rican 24,923 ± 1,923 |
| Montana | Filipino 5,437 ± 654 | Mexican 32,349 ± 1,175 | Puerto Rican 2,537 ± 373 |
| Nebraska | Vietnamese 10,832 ± 1,121 too close to call: vs. Indian 10,753 ± 995 | Mexican 172,513 ± 3,702 | Guatemalan 20,233 ± 2,300 |
| Nevada | Filipino 192,353 ± 4,340 | Mexican 681,607 ± 5,710 | Salvadoran 48,524 ± 2,975 |
| New Hampshire | Indian 11,859 ± 1,188 | Puerto Rican 19,968 ± 1,555 | Puerto Rican 19,968 ± 1,555 |
| New Jersey | Indian 448,645 ± 6,816 | Puerto Rican 475,835 ± 8,802 | Puerto Rican 475,835 ± 8,802 |
| New Mexico | Filipino 17,195 ± 1,469 | Mexican 687,091 ± 6,670 | Puerto Rican 10,970 ± 1,094 |
| New York | Chinese 787,938 ± 9,303 | Puerto Rican 1,004,934 ± 12,759 | Puerto Rican 1,004,934 ± 12,759 |
| North Carolina | Indian 142,203 ± 4,862 | Mexican 600,832 ± 9,150 | Puerto Rican 134,733 ± 5,384 |
| North Dakota | Filipino 5,384 ± 693 | Mexican 22,223 ± 1,078 | Puerto Rican 4,203 ± 672 |
| Ohio | Indian 111,815 ± 3,907 | Mexican 237,328 ± 4,832 | Puerto Rican 145,627 ± 3,869 |
| Oklahoma | Vietnamese 25,368 ± 1,538 | Mexican 389,636 ± 4,352 | Guatemalan 20,602 ± 2,143 too close to call: vs. Puerto Rican 20,005 ± 1,593 |
| Oregon | Chinese 62,860 ± 2,780 | Mexican 488,155 ± 4,230 | Puerto Rican 16,163 ± 1,369 too close to call: vs. Guatemalan 15,763 ± 2,376 |
| Pennsylvania | Indian 173,014 ± 4,984 | Puerto Rican 481,068 ± 7,859 | Puerto Rican 481,068 ± 7,859 |
| Rhode Island | Chinese 10,493 ± 952 too close to call: vs. Indian 10,107 ± 1,194 | Dominican 63,717 ± 4,120 | Dominican 63,717 ± 4,120 |
| South Carolina | Indian 33,760 ± 2,525 | Mexican 177,453 ± 5,248 | Puerto Rican 54,499 ± 3,589 |
| South Dakota | Filipino 4,780 ± 714 | Mexican 23,737 ± 1,017 | Guatemalan 4,273 ± 798 too close to call: vs. Puerto Rican 3,664 ± 766 |
| Tennessee | Indian 43,949 ± 2,277 | Mexican 270,718 ± 5,614 | Guatemalan 44,553 ± 3,517 too close to call: vs. Puerto Rican 42,912 ± 2,745 |
| Texas | Indian 588,500 ± 8,909 | Mexican 9,677,014 ± 24,417 | Salvadoran 377,336 ± 11,029 |
| Utah | Chinese 28,073 ± 1,969 | Mexican 363,157 ± 6,050 | Salvadoran 16,743 ± 2,211 too close to call: vs. Peruvian 16,303 ± 2,221 |
| Vermont | Chinese 3,217 ± 432 too close to call: vs. Indian 2,806 ± 564 | Mexican 3,996 ± 583 too close to call: vs. Puerto Rican 3,471 ± 407 | Puerto Rican 3,471 ± 407 |
| Virginia | Indian 174,842 ± 4,718 | Mexican 210,946 ± 5,674 | Salvadoran 187,301 ± 7,118 |
| Washington | Chinese 227,204 ± 4,819 | Mexican 846,993 ± 6,139 | Puerto Rican 42,821 ± 2,390 |
| West Virginia | Filipino 5,812 ± 683 | Mexican 13,902 ± 1,055 | Puerto Rican 5,654 ± 669 |
| Wisconsin | Hmong 62,696 ± 2,095 | Mexican 319,907 ± 3,852 | Puerto Rican 67,398 ± 2,867 |
| Wyoming | Filipino 2,853 ± 472 | Mexican 46,328 ± 1,061 | Puerto Rican 1,589 ± 462 |
Download the data (CSV) Explore any group, down to the census tract
How we ranked
- Asian groups come from table B02018 and are counted "alone or in any combination": a person who reports two Asian origins counts in both. Hispanic/Latino origins come from B03001 and are mutually exclusive.
- A lead is shown only if the gap between the top two groups is larger than the square root of the sum of their squared 90% margins of error, the Census Bureau's test for two ACS estimates. Otherwise the state is marked too close to call. 17 of 153 state rankings are.
- "Largest other than Mexican" is simply the largest origin once Mexican is set aside, so in the states where Mexican Americans do not lead it repeats the first Latino column.
- Residual categories such as "Other Asian" and "Spaniard" are not ranked. Puerto Rico is not included.
- ACS 2020–2024 5-year estimates for the 50 states and the District of Columbia.