Atlas story
Where every Asian and Latino group is most concentrated
For 29 origin groups, the city where they make up the largest share of residents. It is rarely the city where most of them live.
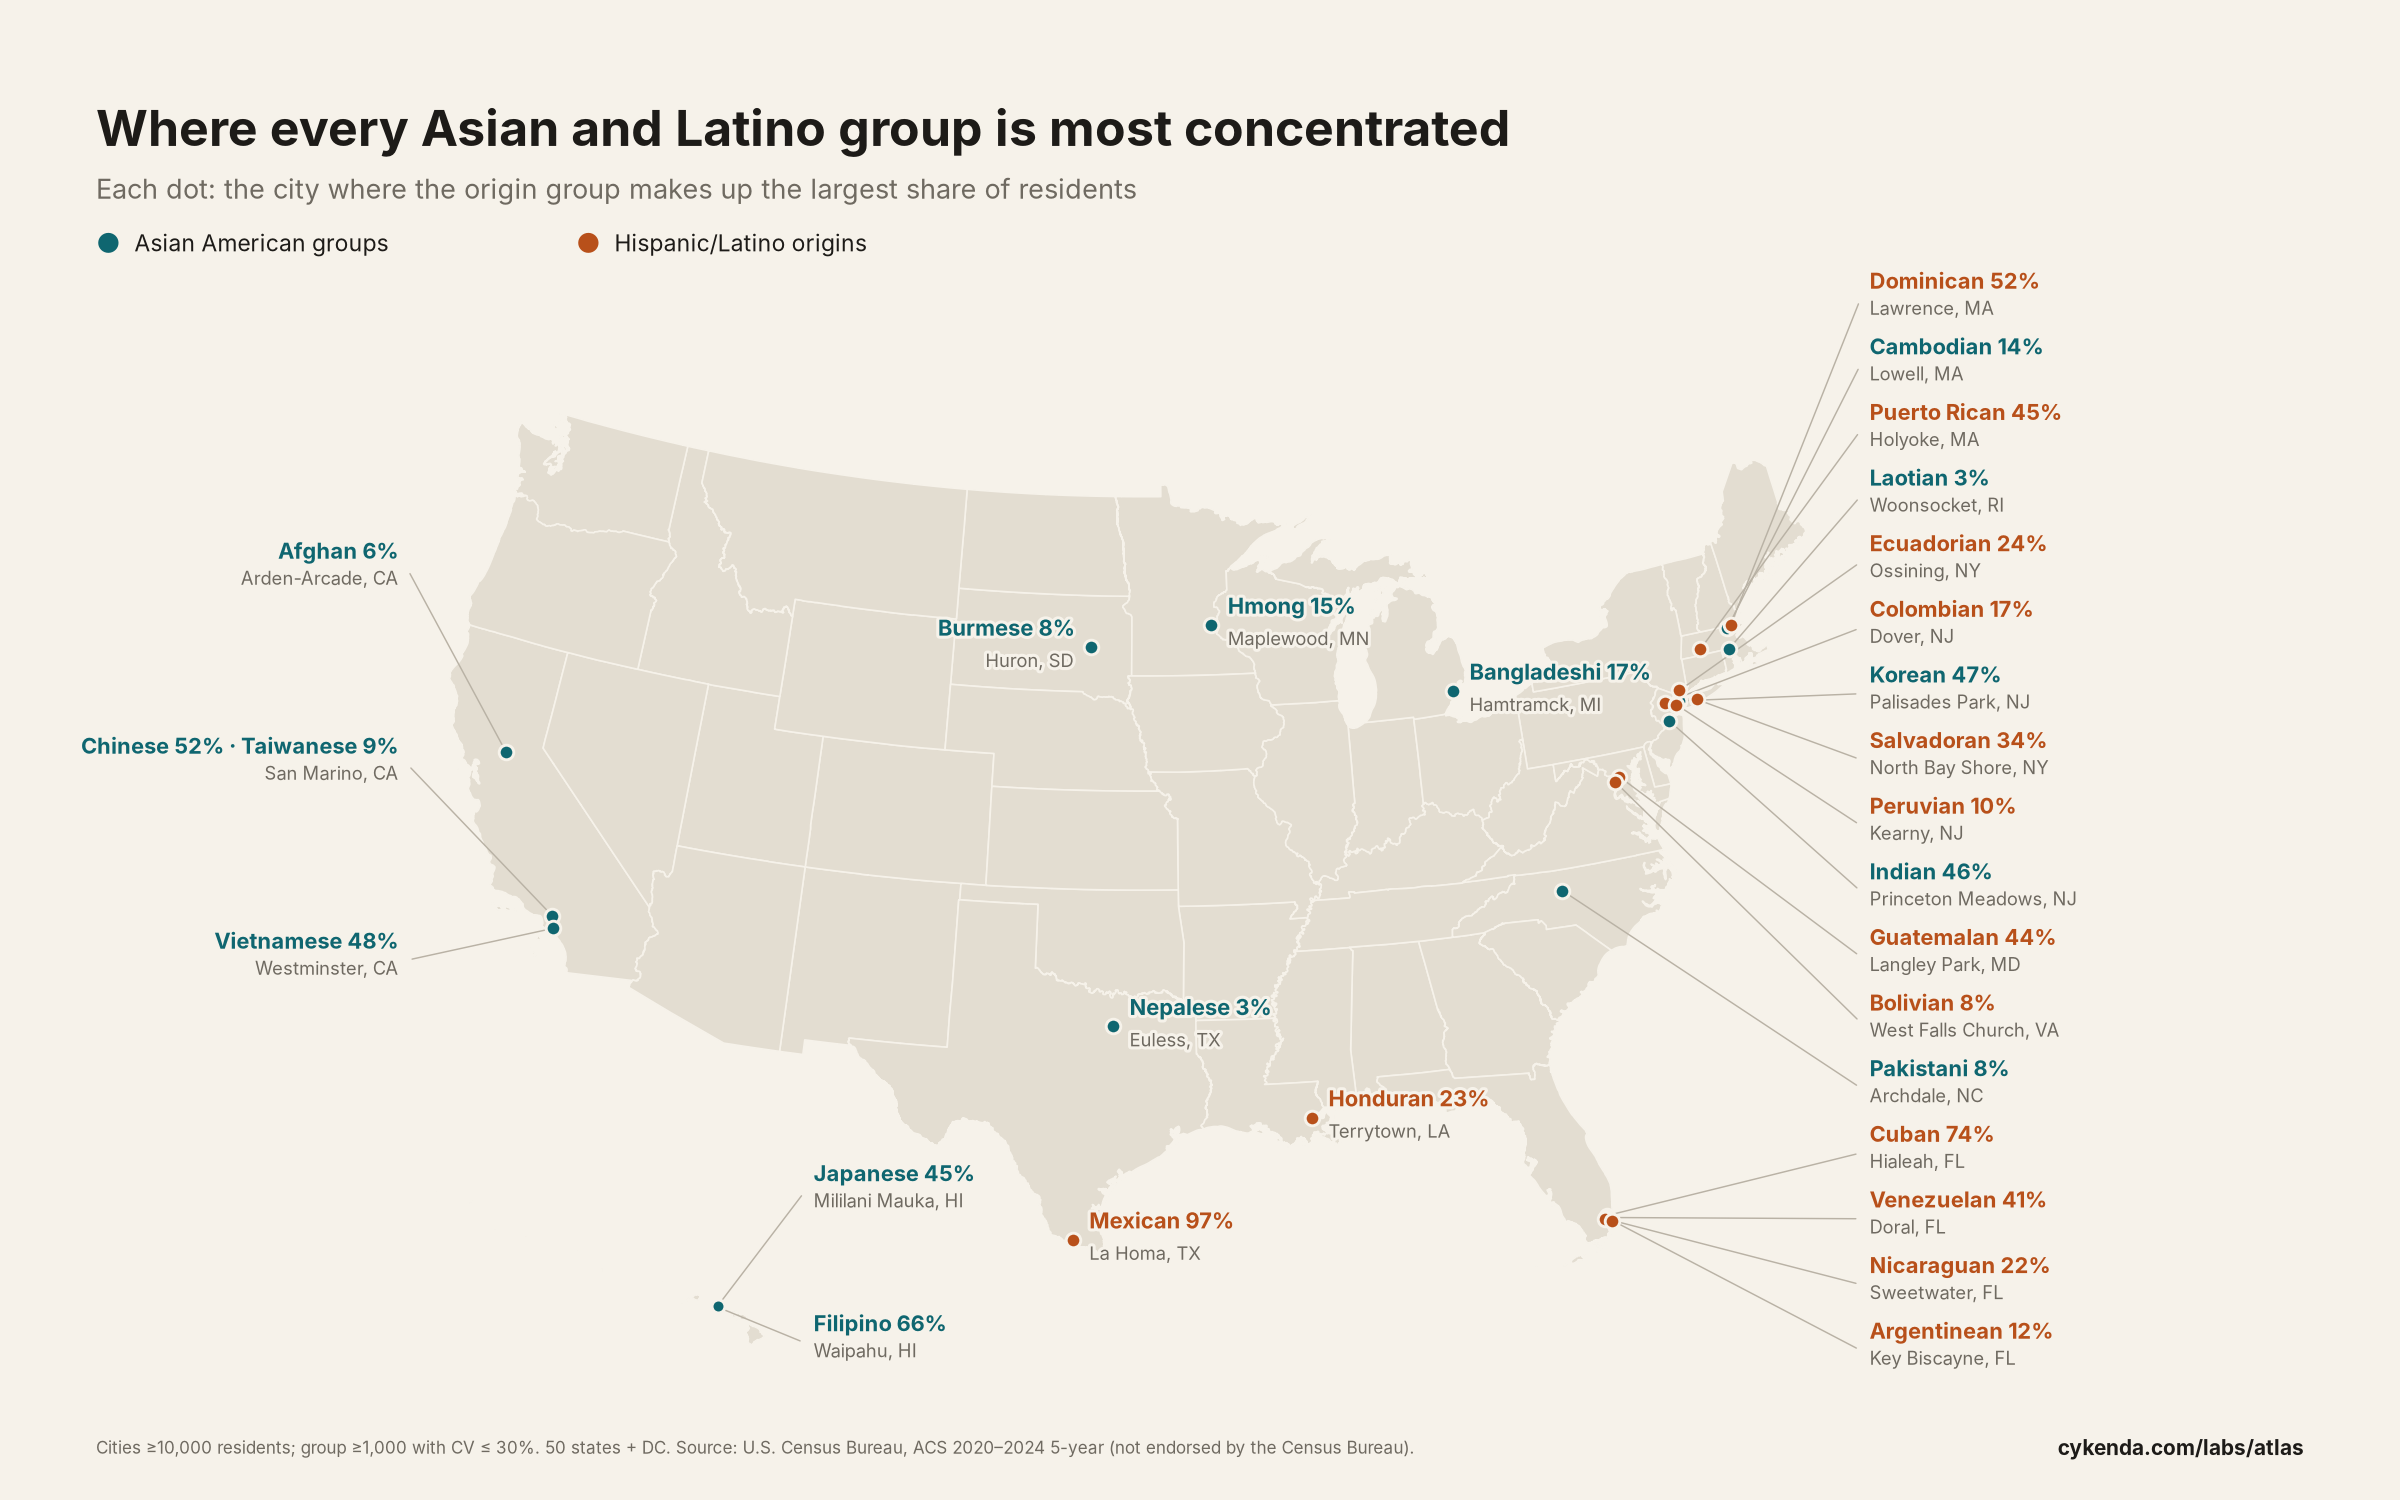
More Korean Americans live in Los Angeles than in any other city. But in Palisades Park, New Jersey, nearly half of all residents (46.9%) are Korean American. That is what this map is about: not where a group is largest, but where it is most concentrated.
We looked at every city and town in the 50 states and DC with at least 10,000 residents and found, for each Asian and Hispanic/Latino origin group, the one where that group makes up the largest share of the population.
What stands out
- In some of these cities the group is the majority: Filipino Americans are 66.4% of Waipahu, HI, and Cuban Americans 73.7% of Hialeah, FL.
- Some are small towns far from the coasts: 8.5% of residents of Huron, SD are Burmese American, 94 times the national share.
- The most concentrated city is often not the largest community: Cambodian Americans are most concentrated in Lowell, MA (14.1%), but the most live in Long Beach, CA.
- One city tops two lists: San Marino, CA, for Chinese (51.7%) and Taiwanese (8.9%) Americans.
- The most concentrated group is Bolivian: in West Falls Church, VA, its share is 175 times the national share.
All 29 groups
Asian American groups
| Group | Most concentrated in | Share of residents | Residents (± MOE) | vs. national share | Largest community | |
|---|---|---|---|---|---|---|
| Filipino | Waipahu, HI | 66.4% | 26,885 ± 2,394 | 40× | Los Angeles, CA | View on map |
| Chinese | San Marino, CA | 51.7% | 6,313 ± 1,052 | 26× | New York, NY | View on map |
| Vietnamese | Westminster, CA | 47.5% | 42,700 ± 2,444 | 58× | San Jose, CA | View on map |
| Korean | Palisades Park, NJ | 46.9% | 9,510 ± 1,132 | 65× | Los Angeles, CA | View on map |
| Indian | Princeton Meadows, NJ | 46.1% | 7,177 ± 1,124 | 27× | New York, NY | View on map |
| Japanese | Mililani Mauka, HI | 44.7% | 9,503 ± 901 | 74× | Honolulu, HI | View on map |
| Bangladeshi | Hamtramck, MI | 17.2% | 4,779 ± 871 | 169× | New York, NY | View on map |
| Hmong | Maplewood, MN | 15.4% | 6,254 ± 1,450 | 115× | St. Paul, MN | View on map |
| Cambodian | Lowell, MA | 14.1% | 16,667 ± 1,742 | 104× | Long Beach, CA | View on map |
| Taiwanese | San Marino, CA | 8.9% | 1,088 ± 316 | 73× | New York, NY | View on map |
| Burmese | Huron, SD | 8.5% | 1,217 ± 555 | 94× | Indianapolis, IN | View on map |
| Pakistani | Archdale, NC | 8.3% | 1,005 ± 427 | 38× | New York, NY | View on map |
| Afghan | Arden-Arcade, CA | 5.9% | 5,563 ± 1,368 | 69× | Arden-Arcade, CA | View on map |
| Nepalese | Euless, TX | 3.1% | 1,900 ± 668 | 37× | New York, NY | View on map |
| Laotian | Woonsocket, RI | 3.1% | 1,335 ± 526 | 37× | San Diego, CA | View on map |
Hispanic/Latino origins
| Group | Most concentrated in | Share of residents | Residents (± MOE) | vs. national share | Largest community | |
|---|---|---|---|---|---|---|
| Mexican | La Homa, TX | 97.3% | 10,983 ± 1,549 | 7× | Los Angeles, CA | View on map |
| Cuban | Hialeah, FL | 73.7% | 166,572 ± 3,169 | 83× | Hialeah, FL | View on map |
| Dominican | Lawrence, MA | 52.3% | 46,383 ± 2,586 | 60× | New York, NY | View on map |
| Puerto Rican | Holyoke, MA | 45.4% | 17,153 ± 918 | 23× | New York, NY | View on map |
| Guatemalan | Langley Park, MD | 44.0% | 9,454 ± 1,472 | 64× | Los Angeles, CA | View on map |
| Venezuelan | Doral, FL | 41.0% | 32,477 ± 2,375 | 145× | Doral, FL | View on map |
| Salvadoran | North Bay Shore, NY | 33.7% | 6,844 ± 1,521 | 36× | Los Angeles, CA | View on map |
| Ecuadorian | Ossining, NY | 24.0% | 6,463 ± 1,740 | 74× | New York, NY | View on map |
| Honduran | Terrytown, LA | 22.9% | 5,660 ± 1,672 | 52× | Houston, TX | View on map |
| Nicaraguan | Sweetwater, FL | 22.4% | 4,494 ± 856 | 120× | Miami, FL | View on map |
| Colombian | Dover, NJ | 17.3% | 3,214 ± 834 | 33× | New York, NY | View on map |
| Argentinean | Key Biscayne, FL | 12.0% | 1,776 ± 743 | 110× | New York, NY | View on map |
| Peruvian | Kearny, NJ | 10.3% | 4,186 ± 928 | 38× | New York, NY | View on map |
| Bolivian | West Falls Church, VA | 8.5% | 2,651 ± 985 | 175× | New York, NY | View on map |
Download the data (CSV) Explore any group, down to the census tract
How we picked the cities
- Cities and towns (incorporated places and census-designated places) with at least 10,000 residents.
- The group must number at least 1,000 people there, with a coefficient of variation of 30% or less, so that each city is a real community rather than sampling noise.
- A group is included only if its top share is at least 2%. Below that, no city stands out for the group: Mongolian, Okinawan, Indonesian, Malaysian, Mien, Singaporean, Thai, Bhutanese, Sikh, Sri Lankan, Kazakh, Uzbek, Costa Rican, Panamanian, Chilean, Paraguayan, Uruguayan.
- Excluded: residual categories such as "Other Asian", and "Spaniard", whose top city is Española, New Mexico. That reflects New Mexico's Hispano heritage, not immigration from Spain, and listing it as where Spanish Americans are most concentrated would mislead.
- Puerto Rico is not included, because Puerto Rican origin is the majority there by definition. That is why the Puerto Rican city on this map is Holyoke, Massachusetts.
- Asian origins are counted "alone or in any combination": a person who reports two origins counts in both. Hispanic/Latino origins are mutually exclusive.