Atlas story
America's most diverse cities
In the most diverse large cities, two residents picked at random are more likely than not to belong to different groups, and no group is a majority.
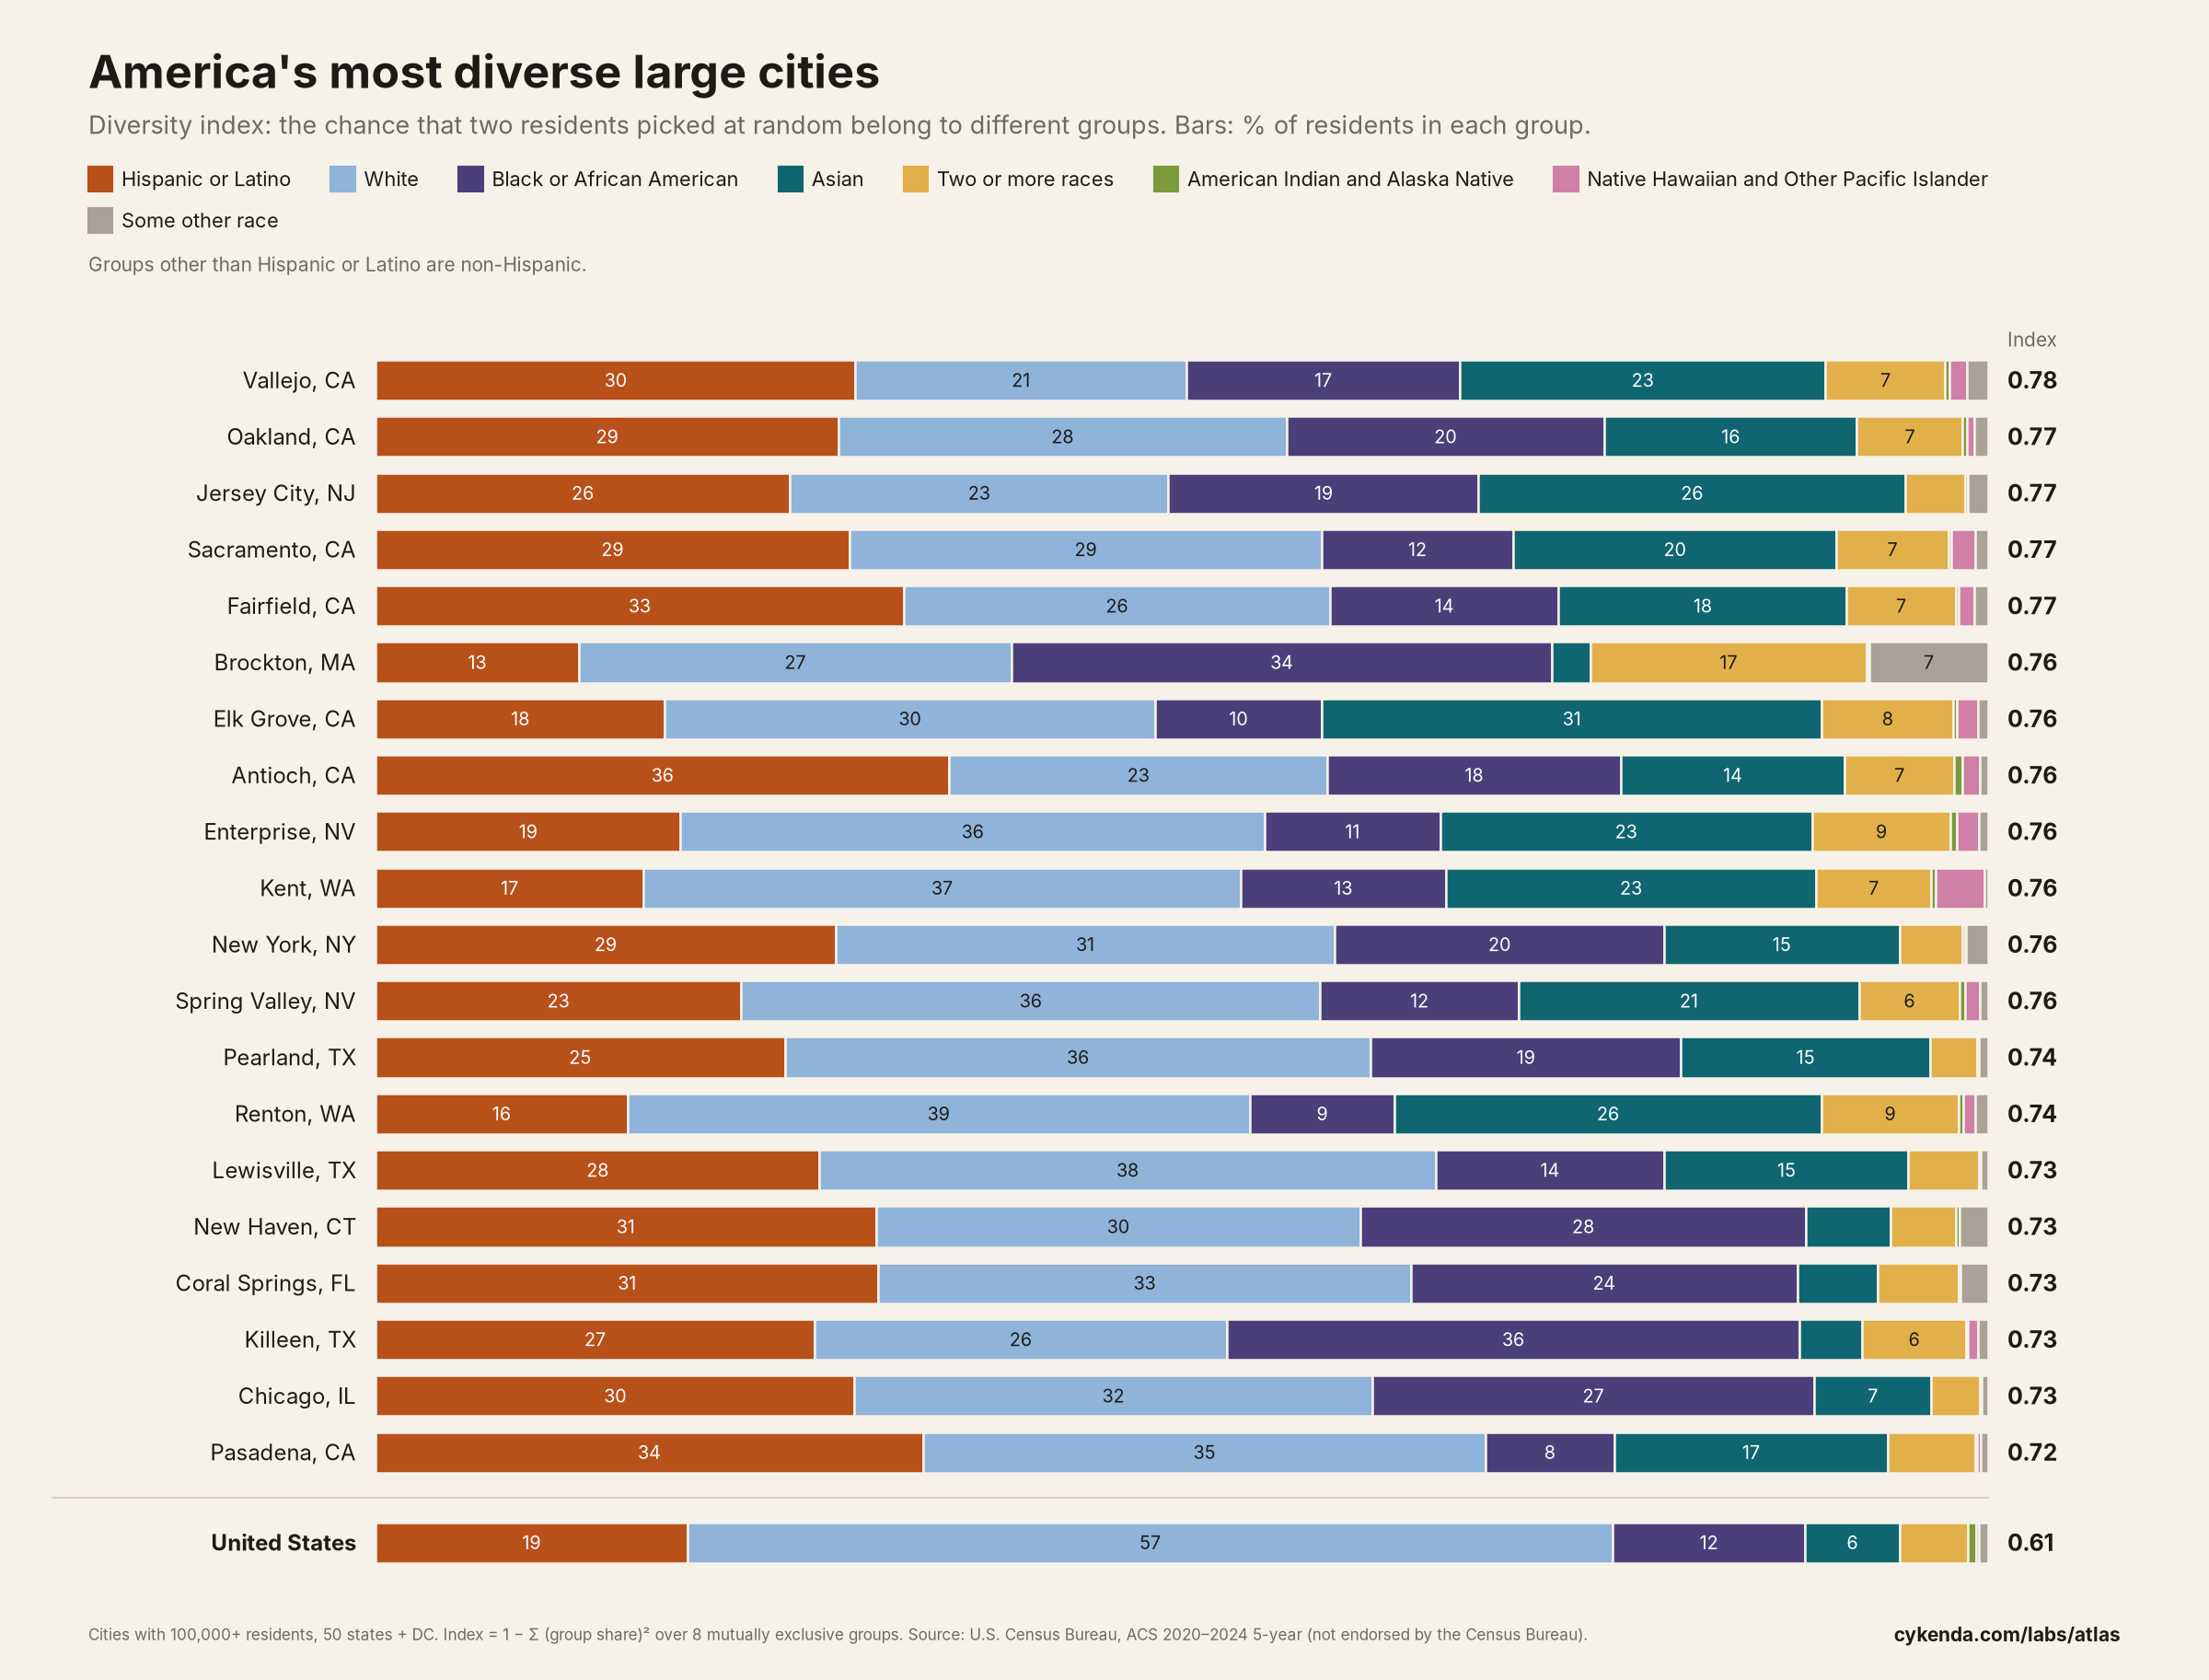
How diverse is a city? One simple measure asks: if you picked two residents at random, how likely is it that they belong to different racial or ethnic groups? In a city where everyone belongs to one group the answer is 0; the more evenly people are spread across groups, the closer it gets to 1.
We computed this diversity index for all 347 cities in the 50 states and DC with at least 100,000 residents, using 8 groups that count every person exactly once. For the country as a whole it is 0.61.
What stands out
- The most diverse large city is Vallejo, CA, with an index of 0.78: a 78% chance that two residents picked at random belong to different groups. For the United States as a whole the chance is 61%.
- 7 of the top 20 are in California. The rest are spread over 9 other states: Texas (3), Nevada (2), Washington (2), Connecticut (1), Florida (1), Illinois (1), Massachusetts (1), New Jersey (1) and New York (1).
- In none of the top 20 does any group make up a majority. Across all 347 large cities, 147 have no majority group.
- Among the top 20, the largest group makes up between 26% (Jersey City, NJ) and 39% (Renton, WA) of residents. The largest group is White in 8, Hispanic or Latino in 4 and Black or African American in 2; not counted, because the top two are within the margin of error: Jersey City, NJ (Asian and Hispanic or Latino), Sacramento, CA (Hispanic or Latino and White), Elk Grove, CA (Asian and White), New Haven, CT (Hispanic or Latino and White), Coral Springs, FL (White and Hispanic or Latino) and Pasadena, CA (White and Hispanic or Latino).
- Size is not what sets them apart: New York, NY and Chicago, IL are on the list, but so are 13 cities with fewer than 200,000 residents.
The 25 most diverse large cities
| City | Diversity index | Largest group | Second largest | Residents | |
|---|---|---|---|---|---|
| Vallejo, CA | 0.78 | Hispanic or Latino 30% | Asian 23% | 124,268 | View on map |
| Oakland, CA | 0.77 | Hispanic or Latino 29% | White 28% | 439,418 | View on map |
| Jersey City, NJ | 0.77 | Asian 26% within the margin of error of Hispanic or Latino: no clear largest group | Hispanic or Latino 26% | 294,078 | View on map |
| Sacramento, CA | 0.77 | Hispanic or Latino 29% within the margin of error of White: no clear largest group | White 29% | 528,706 | View on map |
| Fairfield, CA | 0.77 | Hispanic or Latino 33% | White 26% | 120,785 | View on map |
| Brockton, MA | 0.76 | Black or African American 34% | White 27% | 105,386 | View on map |
| Elk Grove, CA | 0.76 | Asian 31% within the margin of error of White: no clear largest group | White 30% | 179,155 | View on map |
| Antioch, CA | 0.76 | Hispanic or Latino 36% | White 23% | 116,477 | View on map |
| Enterprise, NV | 0.76 | White 36% | Asian 23% | 240,464 | View on map |
| Kent, WA | 0.76 | White 37% | Asian 23% | 135,603 | View on map |
| New York, NY | 0.76 | White 31% | Hispanic or Latino 29% | 8,483,844 | View on map |
| Spring Valley, NV | 0.76 | White 36% | Hispanic or Latino 23% | 219,187 | View on map |
| Pearland, TX | 0.74 | White 36% | Hispanic or Latino 25% | 127,514 | View on map |
| Renton, WA | 0.74 | White 39% | Asian 26% | 105,317 | View on map |
| Lewisville, TX | 0.73 | White 38% | Hispanic or Latino 28% | 131,080 | View on map |
| New Haven, CT | 0.73 | Hispanic or Latino 31% within the margin of error of White: no clear largest group | White 30% | 134,349 | View on map |
| Coral Springs, FL | 0.73 | White 33% within the margin of error of Hispanic or Latino: no clear largest group | Hispanic or Latino 31% | 136,103 | View on map |
| Killeen, TX | 0.73 | Black or African American 36% | Hispanic or Latino 27% | 158,159 | View on map |
| Chicago, IL | 0.73 | White 32% | Hispanic or Latino 30% | 2,711,226 | View on map |
| Pasadena, CA | 0.72 | White 35% within the margin of error of Hispanic or Latino: no clear largest group | Hispanic or Latino 34% | 136,969 | View on map |
| Arlington, TX | 0.72 | White 34% | Hispanic or Latino 32% | 397,742 | View on map |
| San Mateo, CA | 0.72 | White 34% | Asian 28% | 103,105 | View on map |
| Orlando, FL | 0.72 | Hispanic or Latino 35% | White 31% | 319,758 | View on map |
| Paradise, NV | 0.72 | Hispanic or Latino 37% | White 34% | 185,913 | View on map |
| North Las Vegas, NV | 0.72 | Hispanic or Latino 42% | White 23% | 278,595 | View on map |
Download all 347 cities (CSV) Explore any group, down to the census tract
How we measured it
- The diversity index is 1 minus the sum of the squared shares of each group (Simpson's index). It equals the probability that two residents chosen at random belong to different groups.
- It uses the Census Bureau's 8 mutually exclusive categories, which add up to the whole population: Hispanic or Latino (of any race), and, for everyone else, White, Black or African American, Asian, American Indian and Alaska Native, Native Hawaiian and Other Pacific Islander, some other race, and two or more races.
- The index depends on how groups are defined. Here Asian Americans are one group, not 33 origins, and Hispanic or Latino residents are one group, not 28. With finer groups every city would score higher, and the order would change.
- Cities are incorporated places and census-designated places in the 50 states and DC with at least 100,000 residents (347 cities). The national figure covers the whole country.
- ACS figures are survey estimates with margins of error. We did not test the index itself for statistical significance; for the top cities, differences in the third decimal place are within sampling noise, so cities with nearly equal values should be read as ties rather than as a strict order.
- A higher or lower index is a description of a city's population, not a judgement of it.